Selected Work
// Each project tells a story. Hover to explore.
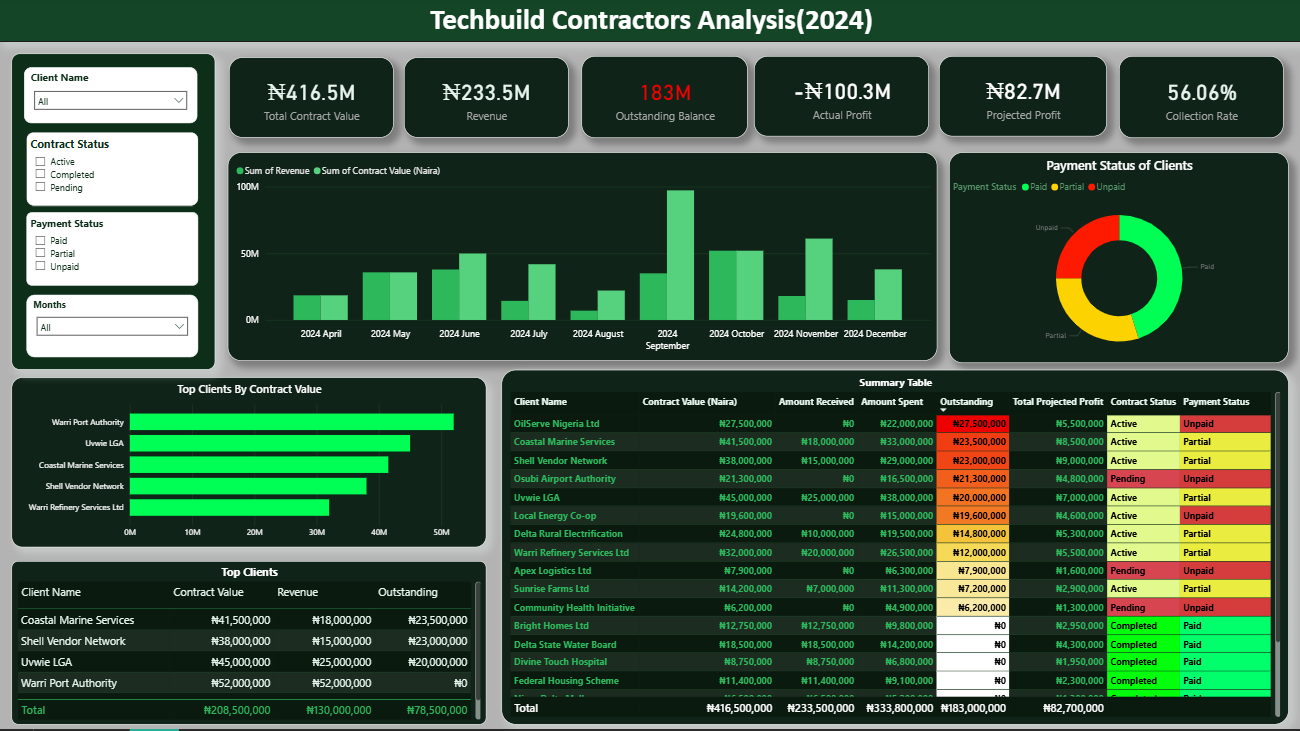
Techbuild Contractors Analysis
"Good contracts. Bad collections. The business is financing its own clients."
Techbuild holds ₦416.5M in contract value — yet actual profit sits at a negative ₦100.3M. This two-page Power BI analysis exposes exactly why: a 56.06% collection rate, ₦183M in outstanding receivables, and 25% of clients who have made zero payments to date.
Management can immediately identify which clients pose zero-payment risk (Oilserve, Osubi Airport Authority, Local Energy Co-op), which contracts carry government dependency risk, and exactly which actions would recover ₦183M in cash flow. The insights page helps turn the data into a board-level decision document.
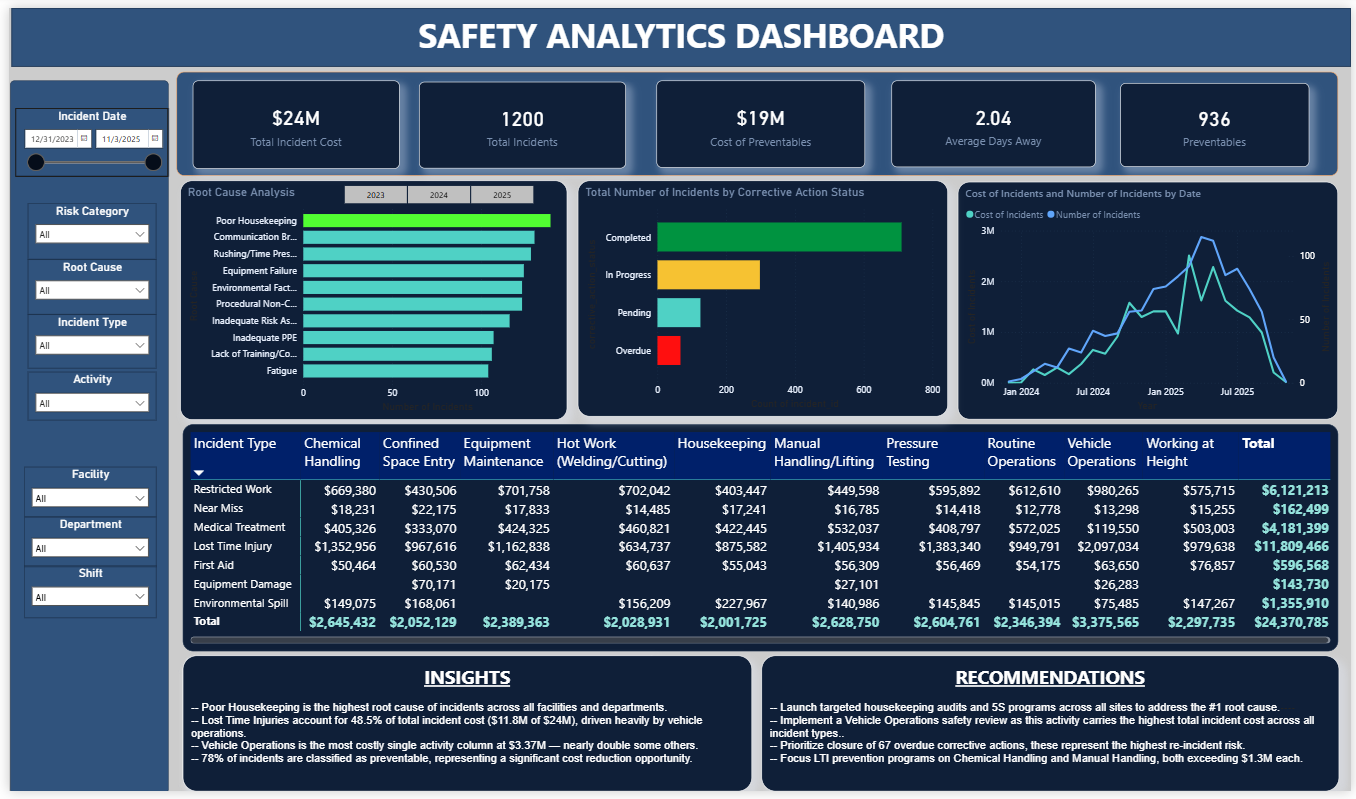
Safety Analytics Dashboard
"$24M in incident costs — but 79% of it was preventable."
Across 1,200 incidents and two years of data, this dashboard answers the question every HSE director needs to answer: where exactly is the money going, and why does it keep happening? The analysis covers incident costs by type and activity, root cause frequency, and corrective action compliance — all filterable by facility, department, shift, and risk category.
Safety managers can see in one view that Poor Housekeeping is the leading root cause — not equipment failure, not fatigue — and redirect training budget, inspection time, and corrective action effort accordingly. Lost Time Injuries in Routine Operations represent the single largest cost category at $11.8M, giving operations directors a clear priority for intervention.
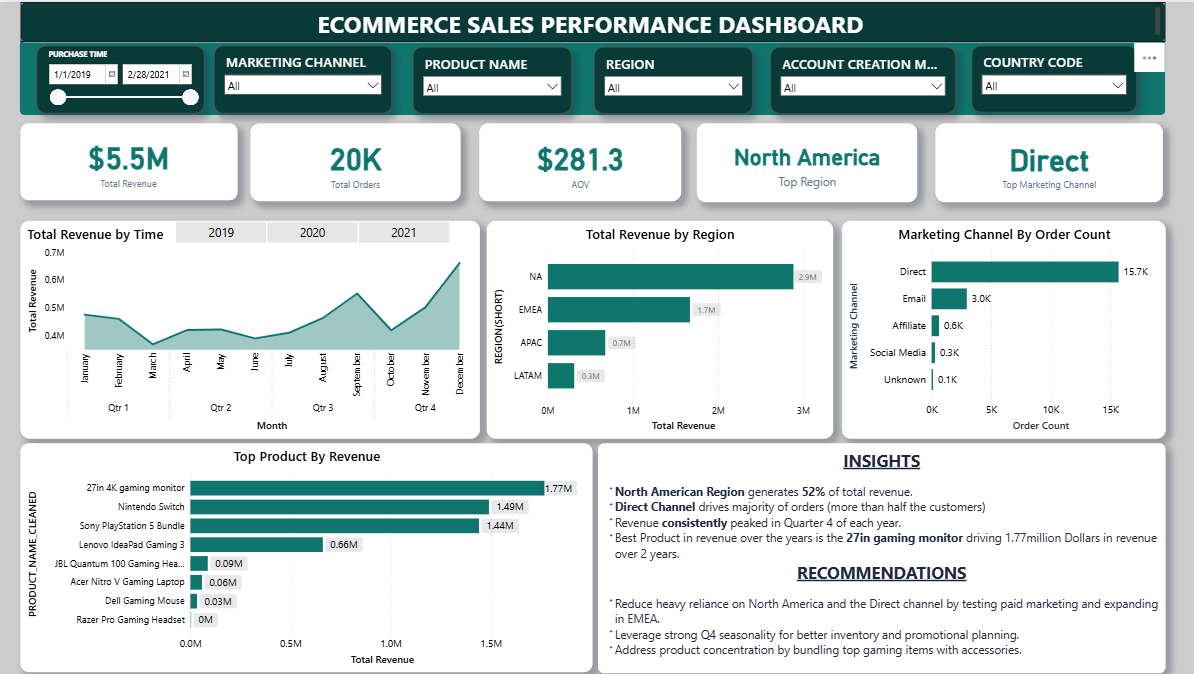
Ecommerce Sales Performance
"$5.5M in revenue — but which region, product, and channel is actually driving it?"
A 1-page Power BI report analysing ecommerce revenue performance across 2019–2021. With 20,000 orders, a $281 average order value, and four global regions.
North America drives 52% of revenue but represents a concentration risk — over-reliance on a single region. The direct channel generates 15.7K orders versus Social Media's 0.3K, meaning the acquisition strategy is almost entirely organic, with significant untapped growth potential in other marketing channels. Revenue peaks every Q4 without exception, enabling confident seasonal planning. The 27-inch 4K gaming monitor alone generates $1.77M — nearly 32% of total revenue from a single product.
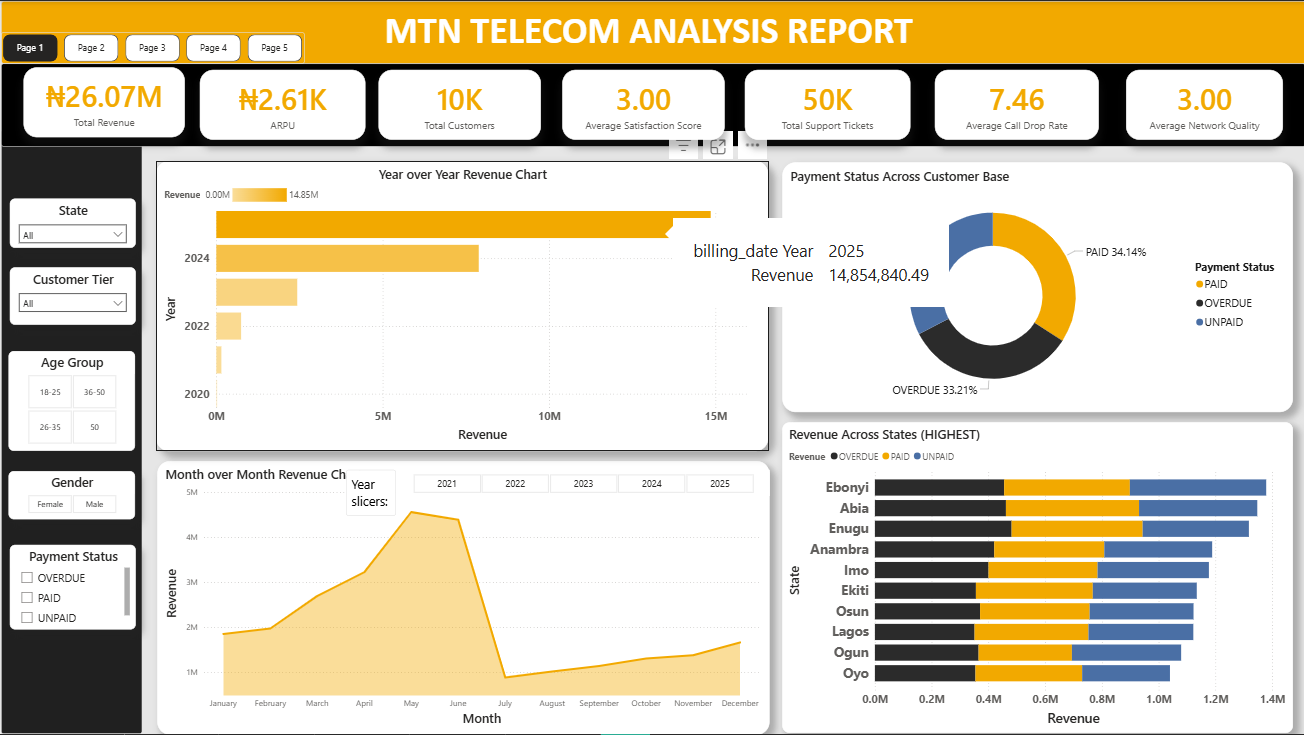
MTN Nigeria Telecom Operations Intelligence Dashboard
How can telecom leadership identify network performance issues, revenue collection risks, and customer experience challenges across Nigerian states?
Built a 5-page Power BI operational intelligence dashboard on a 10,000-customer telecom dataset using PostgreSQL, Python, and Power BI. The solution monitored revenue, collections risk, network quality, customer satisfaction, support demand, and payment behaviour across Nigeria.
• Identified states with below-average network quality and elevated call-drop rates.
• Quantified revenue exposure associated with overdue and unpaid customer segments.
• Highlighted regions combining poor customer experience and weak network performance.
• Developed a prioritisation framework for infrastructure improvement and customer retention initiatives.
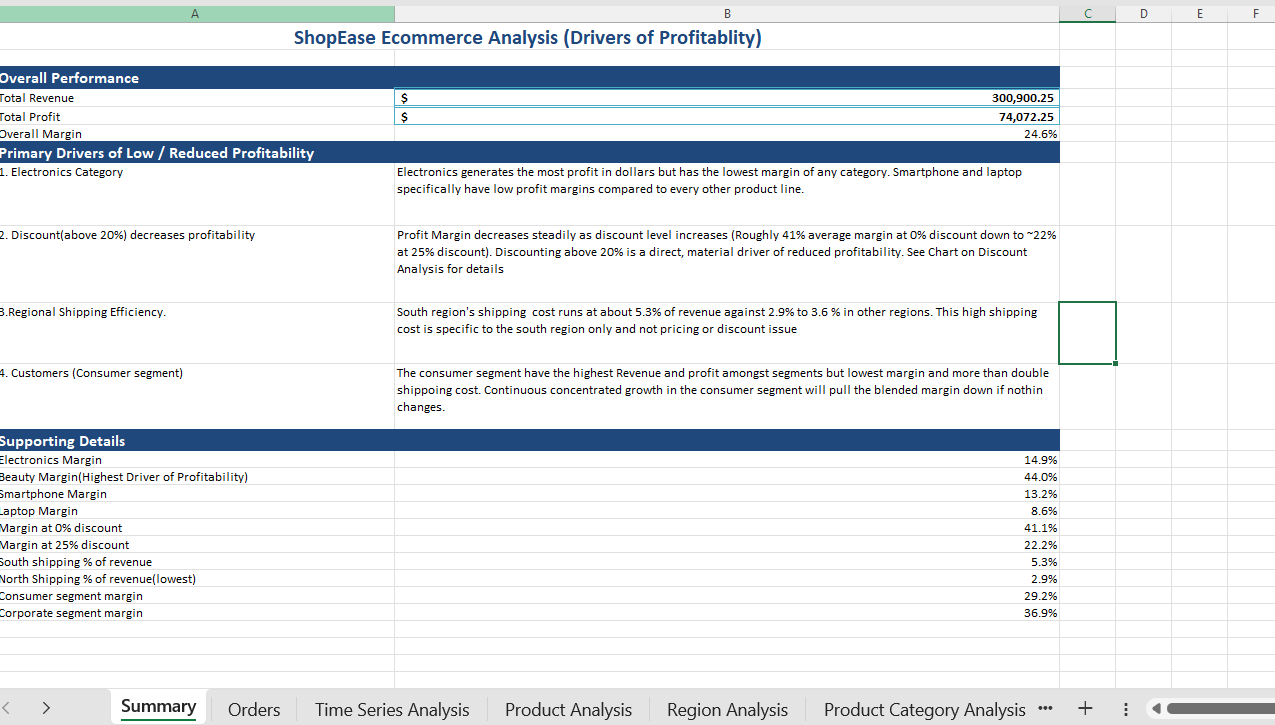
ShopEase Ecommerce Profitability Analysis
"$300,900 in revenue and a healthy-looking 24.6% margin — but discounting past 20% is quietly cutting that margin in half."
An Excel pivot-table analysis of 1,000 ecommerce orders, breaking down $300,900 in revenue and $74,072 in profit across region, product category, customer segment, and discount level to find exactly where margin was being lost.
Finance can see that discounting above 20% drops margin from roughly 41% to about 22%, giving a clear threshold for pricing policy. Electronics drives the largest profit in dollar terms but carries the lowest margin of any category, while the South region's shipping cost runs at 5.3% of revenue versus 2.9–3.6% elsewhere — an isolated, fixable cost leak. The Consumer segment generates the most revenue and profit but the lowest margin (29.2% vs. 36.9% for Corporate), flagging a margin risk as that segment continues to grow.